
Good to be back writing here again. I’ve been heads down with client work and honestly, life — but I’ve got a backlog of practical tips I’ve been meaning to share and it’s time to get them out. Starting with this one, because I see this problem constantly.
If you’ve ever had to reconcile your payment processor report against your own records, or compare a downloaded bank statement against what you’ve entered in your accounting software, you know the frustration. Two sources of data, 200 to 300 rows of varying amounts, and somewhere in there the numbers don’t agree. The question is — where?Most people either eyeball it row by row, reach for VLOOKUP, or try the duplicate highlight in conditional formatting. I’m going to show you why sort and filter beats all three — and why it only takes two to three minutes once you know how.
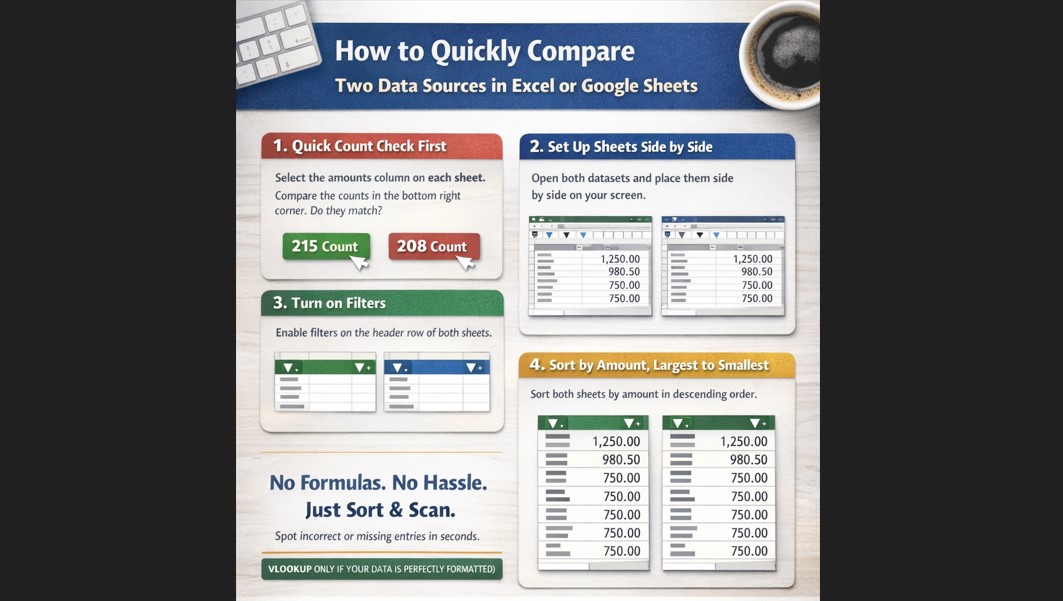
Start with a count check — before anything else
This is the step most people skip and it’s the quickest win in the process. Select the amounts column on each source and glance at the bottom right of your screen. Excel and Google Sheets both display a live count of your selected cells there. If one source shows 215 rows and the other shows 208 you already know seven transactions are unaccounted for before you’ve done a single thing. Five seconds, immediate insight.
Set up your two sources side by side
Open both datasets in separate workbooks and place them side by side on your screen. You’ll often already have them as separate files — your processor export in one, your own records in another. Keep both clean and untouched throughout the process. Don’t edit, don’t delete, don’t reformat anything until your comparison is done.
Enable filters on both sheets
Click the header row on each sheet and turn on the filter. This locks your column headers in place while you sort and slice the data beneath them.
Sort both sheets by amount, largest to smallest
Apply the same sort on both sheets. This is where the magic happens — similar amounts group together, patterns emerge, and anything that looks out of place immediately draws your eye. Incorrectly entered amounts, missing transactions, anomalies — they all stand out when the data around them is organised and consistent.
And here’s the part that surprises people: 200 to 300 rows of sorted data takes two to three minutes to visually scan. That’s it. Your eye is remarkably good at catching the odd one out when everything around it is in order.
Why I don’t rely on VLOOKUP for this
VLOOKUP works beautifully when both data sources are perfectly clean and identically formatted. In the real world that almost never happens. A transaction showing as $1,250.00 in one source and $1,250 in another will trip VLOOKUP up entirely — a false mismatch that sends you chasing a problem that doesn’t exist. Data exported from two different systems will almost always have subtle formatting differences, and cleaning it to the standard VLOOKUP needs often takes longer than just doing the visual comparison in the first place.
What about the duplicate highlight in conditional formatting?
It can work — if you isolate and select the amounts columns from both sources together it will flag values that appear in both. But the moment you isolate just the amounts column you lose sight of everything else in that row. The vendor name. The account it was posted to. The transaction reference.
Sort and filter keeps all of that intact. So when you do your visual scan you’re not just checking whether amounts match — you’re checking the full picture. You might find that an amount is identical across both sources but was posted to the wrong account in your records, or recorded under the wrong vendor. Those are the errors that cause real damage at month end and would never be caught by a duplicate check alone. Sort and filter catches them because everything stays in context.
The bottom line
For 200 to 300 rows of real world data pulled from two different systems, sort and filter is faster, more reliable, and more revealing than any formula-based approach. No data cleaning required, no false errors, no losing track of the surrounding context. Just two organised datasets and a quick visual scan.
Give it a try on your next reconciliation — I think you’ll be surprised how much you can catch in just a few minutes.
For more practical bookkeeping and accounting tips, visit me at markhambookkeeping.ca
Have you used a different method to compare large datasets? I’d love to hear what’s working for you — drop it in the comments below.